¡Esta es una revisión vieja del documento!
Tabla de Contenidos
Análisis de Datos
Population lines, idea de los gradientes de Dani → http://spatial.ly/2017/04/population-lines-how-and-why-i-created-it/ https://www.r-bloggers.com/joy-division-population-surfaces-and-pioneering-electronic-cartography/
joyplot with d3 https://beta.observablehq.com/@mbostock/d3-ridgeline-plot
horizon chart with d3 https://beta.observablehq.com/@mbostock/d3-horizon-chart
When projections showed Hurricane Harvey could bring a record setting amount of rain to Houston, the graphics desk at the New York Times started exploring ways of showing the rainfall. After a couple of days of scrambling, we managed to make a map showing both the accumulation and rate of rainfall: → https://roadtolarissa.com/hurricane/
Use a data analytics tool to predict where the Pokemon are going to appear → https://www.pluralsight.com/guides/big-data/use-a-data-analytics-tool-to-predict-where-the-pokemon-are-going-to-appear
a visualization of global weather conditions forecast by supercomputers updated every three ours → https://earth.nullschool.net/about.html https://github.com/cambecc/earth http://www.copernicus.eu/
Using machine learning to identify air pollution exposure profiles associated with early cognitive skills among U.S. children → http://www.sciencedirect.com/science/article/pii/S0269749117313027
This playground exists to showcase a type of Swarm Intelligence known as Flocking. → https://tech.io/playgrounds/1003/flocking-autonomous-agents/going-further
JSGeo2017 → https://www.dropbox.com/s/xak1kodwly80z8z/JSGeo2017.pdf?dl=0
R package to analyze air quality data → https://www.r-bloggers.com/rtimicropem-using-an-r-package-as-platform-for-harmonized-cleaning-of-data-from-rti-micropem-air-quality-sensors/ https://ropensci.org/blog/blog/2017/02/21/ropenaq https://www.r-bloggers.com/working-with-air-quality-and-meteorological-data-exercises-part-2/ https://www.r-bloggers.com/working-with-air-quality-and-meteorological-data-exercises-part-4/
Grupo en valencia, españa → http://safe-tools.dsic.upv.es/airvlc/data-analysis.php https://valenciarusers.files.wordpress.com/2016/04/prediccic3b3n_contaminacic3b3n-lidiacontreras.pdf Los datos que tenemos pueden ser muy similares a estos que se obtienen a partir de strava → https://github.com/marcusvolz/strava
Fondo para una serie de tiempo con escala ICA https://media.licdn.com/mpr/mpr/jc/AAEAAQAAAAAAAAX4AAAAJDIxYTFjMzEzLWUzNzEtNDgzOS1iZDVlLTY4OTgzZTBmZWQxYw.png
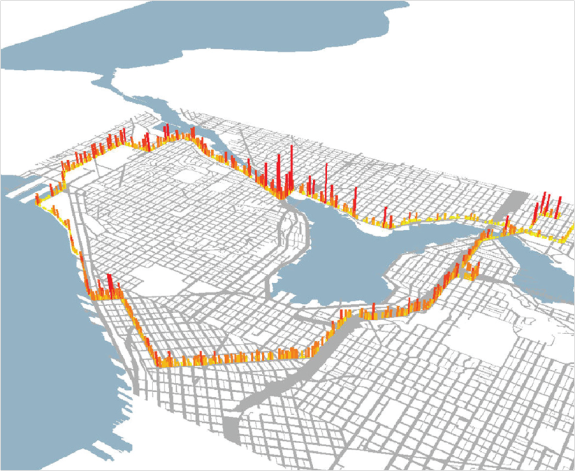
Mapa 3d para visualizar mediciones http://www.seattlebikeblog.com/wp-content/uploads/2014/03/SBB_pollution_map-575x471.png origen de este mapa https://www.researchgate.net/publication/252731674_Exposure_of_Bicyclists_to_Air_Pollution_in_Seattle_Washington_Hybrid_Analysis_Using_Personal_Monitoring_and_Land_Use_Regression Podría implementarse con : http://rgraphgallery.blogspot.com.co/2013/05/rg107-plot-3d-horizontal-lines-bars.html
Artículo CSWA: Aggregation-Free Spatial-Temporal Community Sensing → https://arxiv.org/pdf/1711.05712v1.pdf
Viento y PM25 → http://aqicn.org/faq/2015-11-05/a-visual-study-of-wind-impact-on-pm25-concentration/
Predicción de concentración PM25 usando redes neuronales https://www.sciencedirect.com/science/article/pii/S1352231015001491
Anomaly detection with R → https://www.r-bloggers.com/anomaly-detection-in-r-2/
Animación de la contaminación en china → https://old.reddit.com/r/dataisbeautiful/comments/8v0m98/oc_3d_animation_of_chinas_nitrogen_dioxide/
Predicting Sunspot Frequency with Keras LSTM In R → https://www.r-bloggers.com/time-series-deep-learning-part-2-predicting-sunspot-frequency-with-keras-lstm-in-r/
Metaballs → http://jamie-wong.com/2014/08/19/metaballs-and-marching-squares/
AgentMaps - Social Simulations on Interactive Maps → https://noncomputable.github.io/AgentMaps/
Fans Energy Viz → https://reimaginethegame.economist.com/en/matches/bayern-gladbach/fans
Privacy mobility → https://techxplore.com/news/2018-12-privacy-mobility.html
Proof-of-location → https://www.theatlantic.com/technology/archive/2018/11/can-blockchain-maps-replace-gps/576985/
RETIGO Epa → https://www.epa.gov/hesc/real-time-geospatial-data-viewer-retigo
Visualización interactivas
Query engine
Eventos externos
- Eventos externos como la interacción con la visualización llegan por websockets y se convierten en eventos del mouse
Estilo de la visualización
- Se propone un estilo radial para la serie de tiempo
- ¿cómo visualiza ttn mapper? → http://wireless.ictp.it/school_2018/Slides/Luka/TTN%20Mapper-TTC%20presentation.pdf


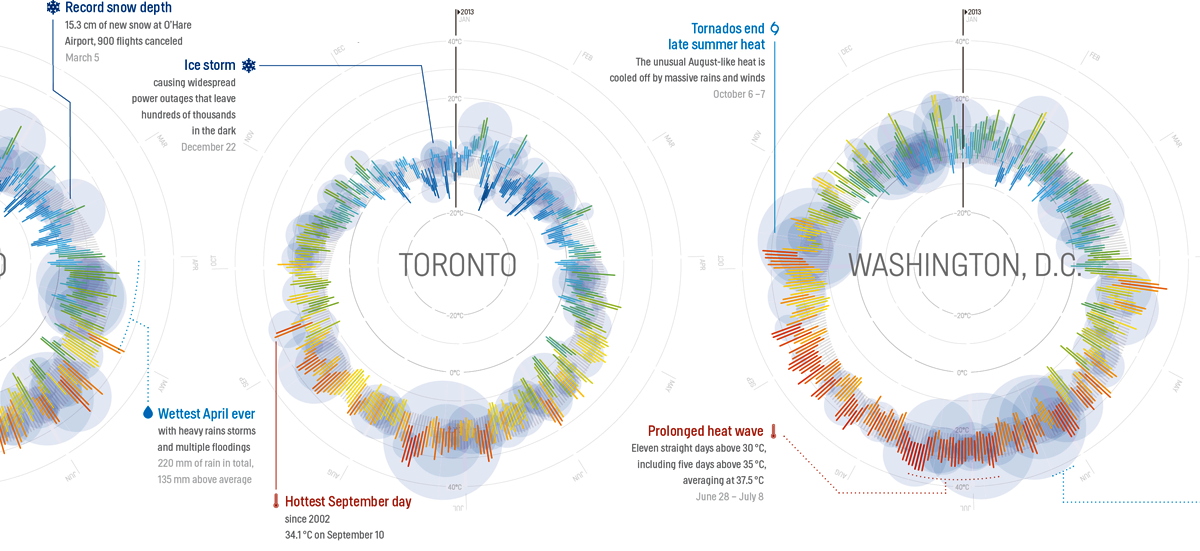


- Circos is a javascript library to easily build interactive graphs in a circular layout. https://nicgirault.github.io/circosJS/

Posible superficie de proyección
De no se posible la proyección se puede ubicar un led en el lugar de la estación y que se ilumine según el promedio de la hora


Privacidad
Modelado de flujos de polución en ciudad y ontología
tratan de definir como sobreponer modelos 3D del aire con modelos de ciudad, dicen que es pesado computacionalmente, el modelo Street Canyons, que representa el flujo de aire entre los edificios, entonces plantean objetos 3D con riqueza semántica para hacer una ontoligía (relaciones) entre esos objetos …. jaja entiendo muy poco pero dejan ideas para explorar como “we could define the concept of potentially polluted street as streets that belong to a street canyon where air flow simulation produces a flow with one or more vortices (thus keeping pollutants in the canyon)” https://arxiv.org/pdf/1201.6511.pdf como algo así supongo que no solo se podría determinar la calidad del aire de una parte de un barrio, sino también por ejemplo que el segundo piso es más vulnerable a producir vórtices de acumulación que el quinto piso